How Project Management Guide Help you Create Streamlined Systems
Last Time we have talking about the dashboard Features are upgraded and multiple practical parts are added for you to explore. More easy-to-use features are coming out!
Print Your Description
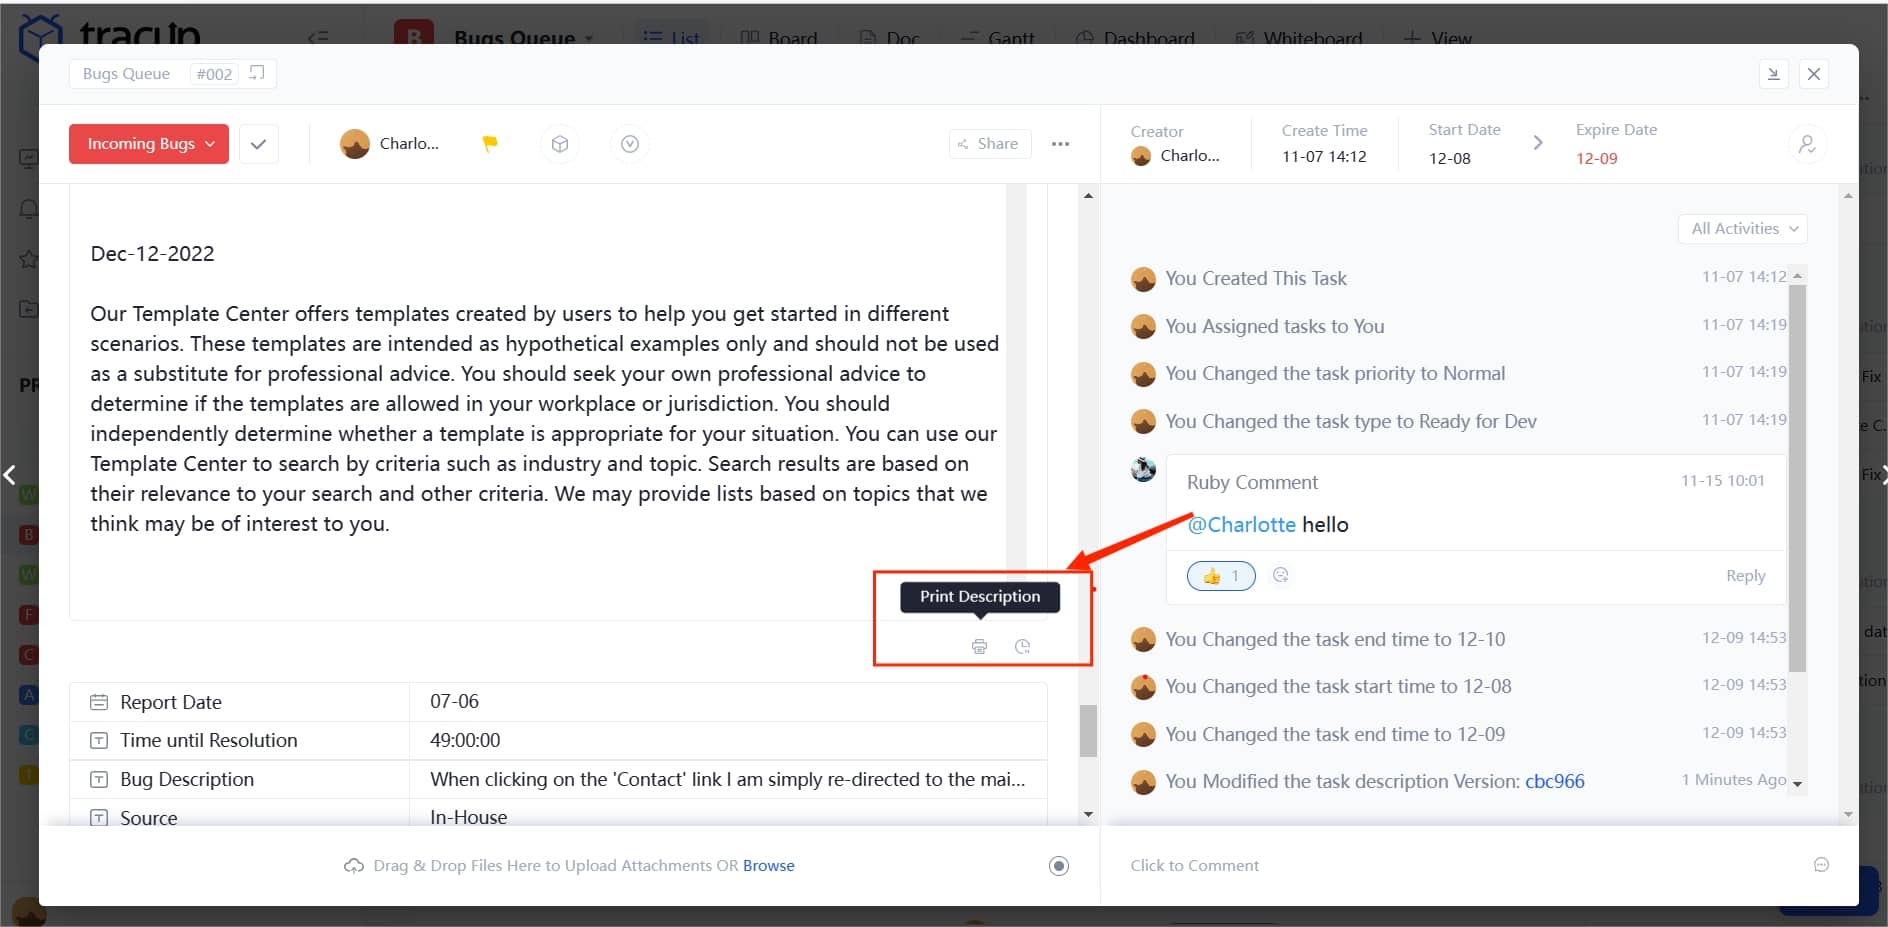
Tracup now supports users print their description page, just click the print bottom in the right corner, this page will be automatically printed by users.
Time Zone Changing
After FIFA World Cup, users must be confused about the different time zone and cannot find a right kick-off time by their zone.
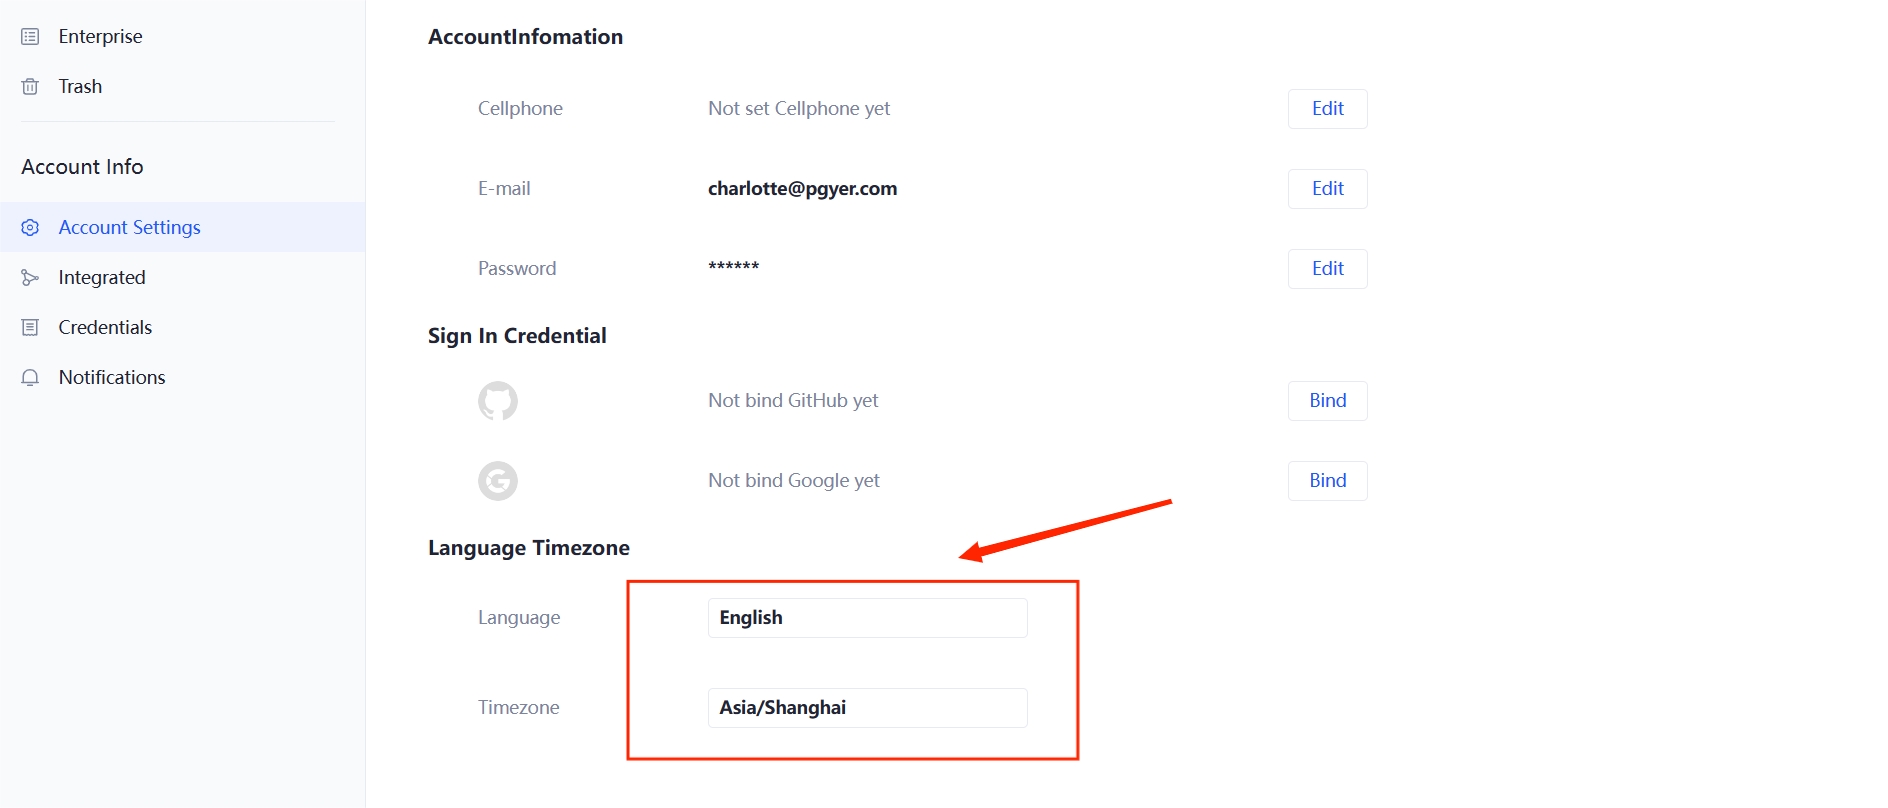
Just put the current time in your country and come to settings and change the time zone you need, then Tracup will help you find the right answer.
In the meantime, users can change their language in account settings.
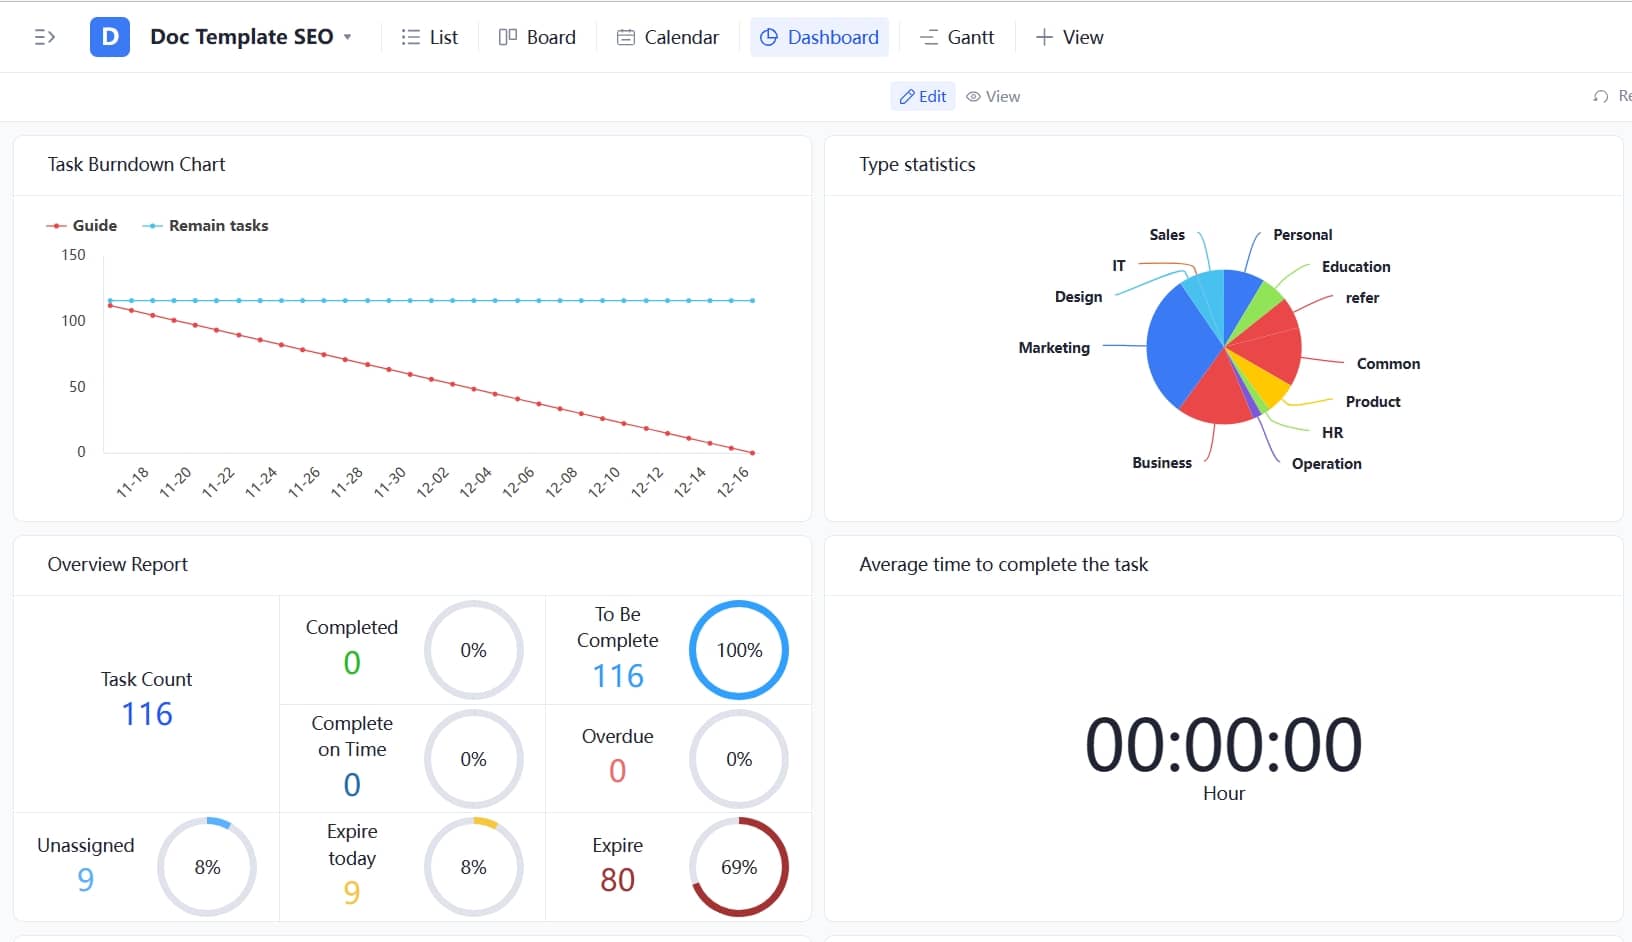
What is a Dashboard?
Visualized data is always more intuitive and specific, which is why we upgrade a project dashboard:
highlighting and describing important project information about the overall progress of a particular project.
![]()
For example, the project dashboard is the project management monitor room, where you can overview the overall situation and track all tasks in the project by managing your custom components.
KPI or project performance can also be presented via the dashboard. Not only that, the dashboard also provides you with details about the status of each project and helps you gain insight into specific business functions, such as marketing, production, or sales.
What can Dashboards do?
Usually, a good project management dashboard template should have real-time updated “widgets” and real-time display data metrics, which help accurately display updated data.
What additional Dashboard features are required?
- Project Activity
- Task Time Usage
- Resource Allocation
Here ‘s what’ dashboards’ currently support, let ‘s take a look at them.
Task management components
(overview reports, project information, average time to complete tasks, etc.)
Task management components can provide you with information about project progress:
- Understand the project progress and data profile
- Understand the dynamic information of project tasks; understand the average time taken to complete tasks in the project
- With these components, you can easily categorize and track any progress in the workspace
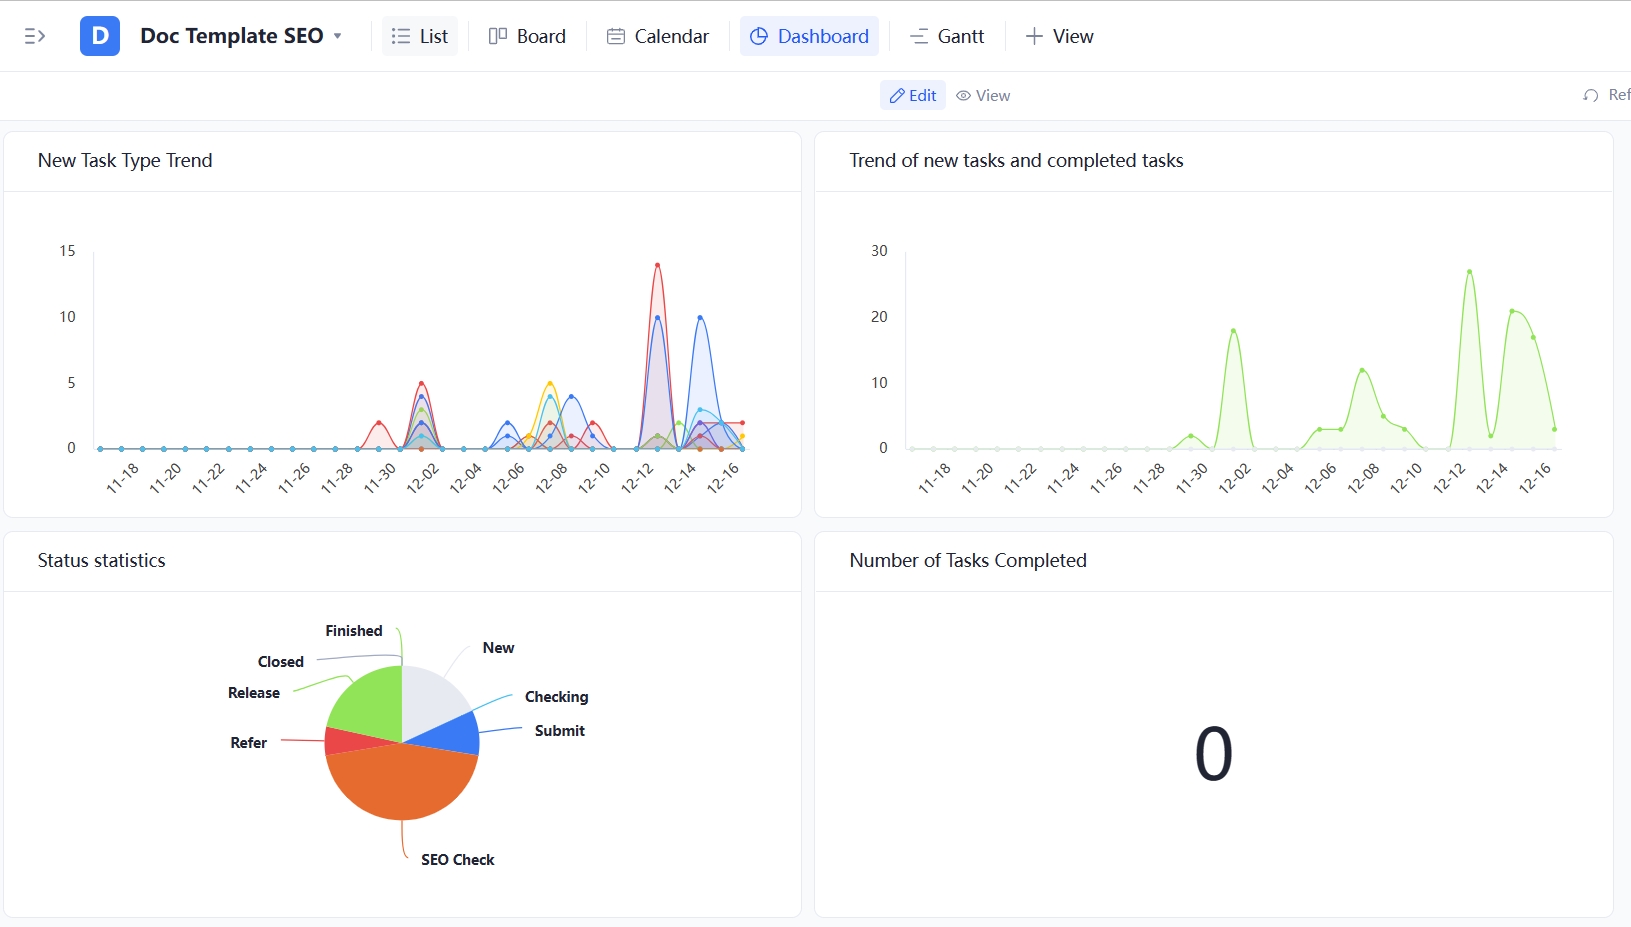
Statistical class components
(type statistics, status statistics, priority statistics)
You can stop doing some repetitive reporting work.
- Statistical components can help you automatically count all aspects of project data
- Understand the comparative trend of newly added or completed tasks in the project
- Understand the number of status tasks of the project; understand the number of priority tasks of the project
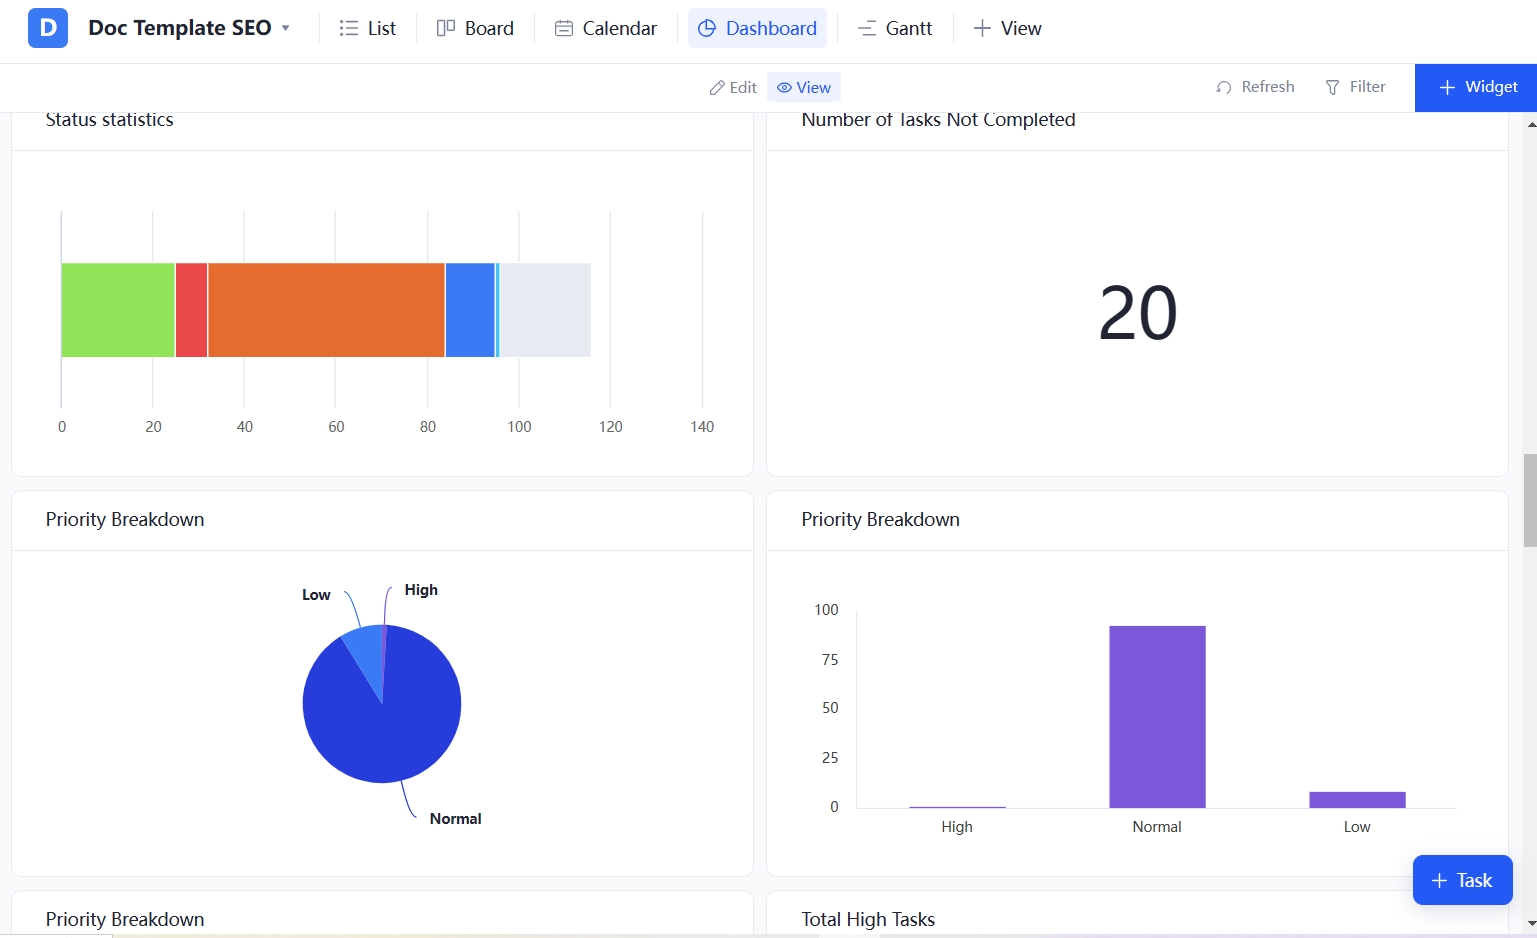
With these components, you can free up your hands to handle more important matters without repeating these tasks.
Resource allocation class components
(creator/designee work schedule, designee task proportion, etc.)
Reasonably allocate resources to team members, which is an important part of project management.
Resource allocation class components help each member of your team understand their responsibilities:
- Understand how each member processes tasks in a project
- Understand how each member processes tasks in a project
- Understand how each member processes tasks in a project
- Understand the number of tasks each member recognizes in a project
These features help you get the most benefit from resource deployment and make the best employees on your team shine.
Burnout diagram
(Understanding Project Progress Data Profile)
Burnout diagram is one of the simplest tools to quickly track project progress and assess completed tasks.
Burndown diagram is a visual representation of the progress of a project, which shows the work done throughout the project.
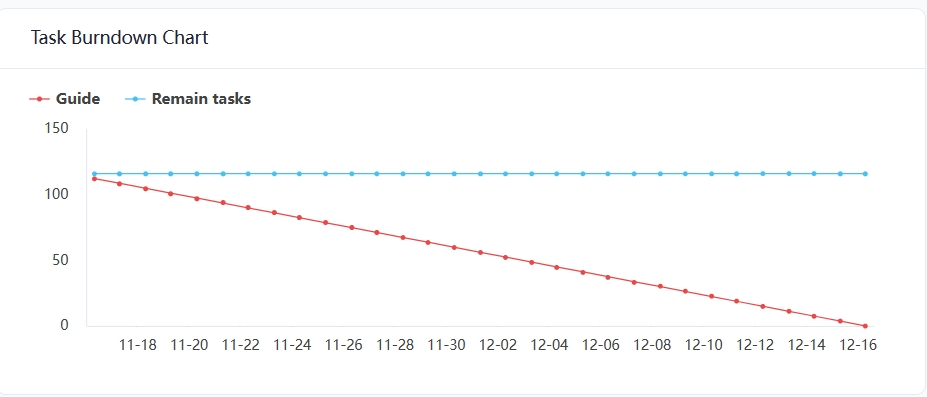
For project managers, this is a simple and quick way.
Burndown diagrams can track what has been done based on parameters such as team members’ working hours.
This makes it easier to predict project progress. There are always new experiences waiting for you to experience it immediately and open more efficient collaborative office methods.
Try Tracup Free and Start Your Productivly Development
Using Tracup to Unlock Powerful Agile Workflow WITHOUT ANY Agile Experiences Required